Example script: batch-processing light-saturated FvFm data
Gerald Page 5/28/2020 https://pageg.github.io
All functions, data and example scripts are available here: https://github.com/PageG/IM-PAM
This demonstration script process all images within a directory and calculates the mean and standard deviation of each image.
If you have multiple samples (i.e. pine needles) within each image, change second argument in the 'proc_single_PAM' function as required - see second example below.
If you want to to retain spatial data, see 'im_pam_tiff.m' or 'im_pam_tiff_fvfm.m' in the third example below.
Contents
Example 1: calculate mean and standard deviation of one sample per image
% Get a list of all files to process
files = dir('./IM-PAM/Data/single_images/');
files = files(3:end);

drs=['./IM-PAM/Data/single_images/']; % in current directory
images = dir([drs '/*.tif']); images = {images.name}; % file names to cell
images = sort_nat(images); % Sort images in numerical order. requires 'sort_nat' function in path

% process single PAM images for light-saturated FvFm, calculating mean and
% standard deviation.
for k = 1:length(images)
    [all_means(k,:), all_sd(k,:)] = proc_single_PAM([drs images{k}], 1); % note second argument is the number of leaves within the image, set here = 1.
end

output = cell2table(images');
output(:,2) = table(all_means);
output(:,3) = table(all_sd);

output.Properties.VariableNames = {'File' 'FvFm_mean' 'FvFm_sd'}


% clear images all_means all_sd drs files images k;

% writetable(output,'PAM_FvFm_example.csv');
output =

  4×3 table

       File       FvFm_mean    FvFm_sd
    __________    _________    ________

    {'23.tif'}     0.70253     0.034196
    {'24.tif'}     0.65912     0.025146
    {'25.tif'}     0.70723     0.020259
    {'26.tif'}     0.69477     0.021676
Example 2: Process images with more than one sample per image
% in this example, each PAM image contains two needles from the same plant

files = dir('./IM-PAM/Data/damaged_needles/');
files = files(3:end);

drs=['./IM-PAM/Data/damaged_needles/']; % in current directory
images = dir([drs '/*.tif']); images = {images.name}; % file names to cell
images = sort_nat(images); % Sort images in numerical order. requires 'sort_nat' function in path

% process single PAM images for light-saturated FvFm, calculating mean and
% standard deviation.
for k = 1:length(images)
    [all_means2(k,:), all_sd2(k,:)] = proc_single_PAM([drs images{k}], 2); % 2 needles per image
end

output2 = cell2table(images');
output2(:,2) = table(all_means2);
output2(:,3) = table(all_sd2);

output2.Properties.VariableNames = {'File' 'FvFm_mean' 'FvFm_sd'}

% writetable(output2,'PAM_FvFm_duplicates_example.csv');
output2 =

  4×3 table

       File            FvFm_mean               FvFm_sd
    ___________    __________________    ____________________

    {'24.tif' }    0.39609    0.51615    0.063361    0.095653
    {'29.tif' }     0.6517    0.63162    0.056161    0.057852
    {'120.tif'}    0.47754    0.50886     0.12644     0.12342
    {'127.tif'}    0.15271    0.37514     0.11989    0.094099
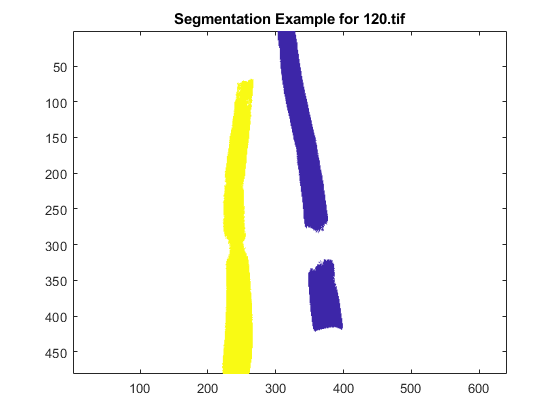
Example 3: retain spatial data and demonstrate 'seg_leaf' function
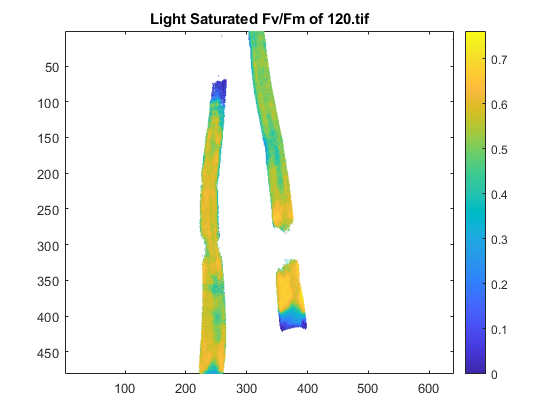
[FvFm] = im_pam_tiff_fvfm([drs images{3}],134);

% PLOTTING
[nr,nc] = size(FvFm(:,:,1));
% subplot(1, 2, 2)
pcolor([FvFm nan(nr,1); nan(1,nc+1)]);
shading flat;
set(gca, 'ydir', 'reverse');
colorbar;
title('Light Saturated Fv/Fm of 120.tif');
% colormap hsv % jet, hsv

% load segmented example figure
openfig('segmented_120.fig');
title('Segmentation Example for 120.tif');
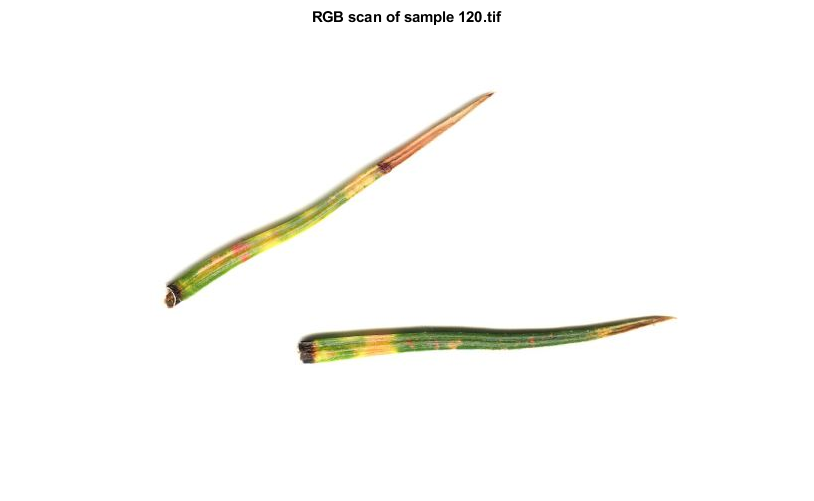
Compare to RGB image
im = imread('120_zoom.jpg');
imshow(im)
title('RGB scan of sample 120.tif')